Child Abuse Statistics 2026 Update: Latest Available U.S. Data
This page presents the latest official U.S. child abuse and neglect statistics for 2026, based on the Children’s Bureau’s Child Maltreatment 2024 report and NCANDS data from all 50 states, Washington, D.C., and Puerto Rico.

CPGN explains official federal data to highlight the scale of child abuse, the importance of prevention, and the ongoing need for child protection.
- Last updated: 29 July 2026
Child abuse remains a serious issue in the United States, and federal child maltreatment data helps show how many children are affected each year. For readers looking for current national statistics in 2026, the most recent official figures come from fiscal year 2024 and were reported through the U.S. child protective services system.
According to the latest federal child maltreatment data, more than 532,000 children were confirmed as victims of abuse or neglect, and 1,773 children died from abuse or neglect. These numbers show why prevention, early reporting, family support, and child protection services remain urgently important.
Key Child Abuse Statistics to Know
- More than 532,000 children were confirmed victims of abuse or neglect.
- Neglect was the most common form of child maltreatment, affecting 79.3% of confirmed victims.
- 1,773 children died from abuse or neglect.
- Children under age 1 had the highest victimization rate.
- More than 2.2 million children received prevention services.
- Nearly 880,000 children received support services after CPS involvement.
Behind Every Statistic Is a Child
More than 532,000 confirmed victims means more than 532,000 children whose safety, stability, and future were placed at risk. Your support helps CPGN strengthen child-abuse awareness, prevention, education, and advocacy.
Help Protect Children Today✓ Child Protection Global Network is a U.S.-registered 501(c)(3) nonprofit organization.
⚠️ Important note: These statistics reflect child maltreatment cases reported to and processed by child protective services agencies. They do not represent every case of child abuse or neglect, because many cases are never reported, investigated, or confirmed.
Global Child Maltreatment Statistics
Child maltreatment is a global child protection crisis affecting children across homes, schools, communities, and care settings. According to the World Health Organization, child maltreatment includes physical abuse, emotional abuse, sexual abuse, neglect, negligence, and exploitation of children under 18.
Global data from UNICEF shows that many children experience violent discipline at home, often through physical punishment or psychological aggression. These numbers highlight the urgent need for stronger child protection systems, prevention programs, safe reporting pathways, and trauma-informed family support.
Key Global Statistics
- 1.6 billion children, or 2 in 3 children globally, regularly experience violent punishment by caregivers at home, according to UNICEF global child protection data.
- Nearly 400 million children under age 5, or 6 in 10 young children globally, regularly experience psychological aggression or physical punishment at home, based on UNICEF’s 2024 violent discipline estimates.
- Child maltreatment can include physical abuse, emotional abuse, sexual abuse, neglect, negligence, and exploitation, as defined by the World Health Organization child maltreatment fact sheet
Reports and Screening Statistics in the U.S.
Federal CPS data shows that agencies screened in 2,058,720 referrals, also known as reports, for an investigation or alternative response. This equals a national screened-in report rate of 28.0 reports per 1,000 children.
A referral is the initial notification made to a CPS agency alleging child maltreatment. If the referral meets
the state’s criteria for CPS action, it is screened in and becomes a report. If it does not meet the criteria for
CPS response, it may be screened out or referred to another community resource.
The report also shows that screened-out referrals have increased over the past five years. In the latest available data , the
national estimate of screened-out referrals was 2,306,000 a year. This makes screening a major part of the child
protection system because it determines which concerns move forward for investigation or alternative
response.
Key statistics:
- 2,058,720 screened-in referrals/reports
- 28.0 per 1,000 children national screened-in report rate
- 2,306,000 estimated screened-out referrals
- 47.1% screened in and 52.9% screened out among reporting states
Who Reports Child Maltreatment?
Most child maltreatment reports come from professionals who interact with children through their work. Federal child welfare data shows that professionals submitted 70.9% of screened-in reports alleging child abuse or neglect.
The largest professional reporting groups were legal and law enforcement personnel (21.8%), education personnel (20.8%), and medical personnel (11.0%). Nonprofessionals, including friends, neighbors, relatives, and parents, submitted 14.7% of reports. The remaining 14.4% came from unclassified sources, including anonymous, unknown, and “other” report sources.
CPGN works with families, educators, healthcare providers, and community leaders to strengthen early identification, safe reporting, and support through its broader child protection services and advocacy work.
Key statistics:
- 70.9% of reports came from professionals
- 21.8% from legal and law enforcement personnel
- 20.8% from education personnel
- 11.0% from medical personnel
- 14.7% from nonprofessionals
- 14.4% from unclassified sources
Child Abuse and Neglect Statistics
According to the latest available federal data 2,990,234 children received either an investigation or an alternative response from Child Protective Services (CPS) agencies in a calendar year. This represents a national rate of 40.6 children per 1,000 in the U.S. child population.
These CPS responses are part of a broader child protection system designed to assess safety, determine
whether maltreatment occurred, and identify whether children and families need services. Some children
are found to be victims of abuse or neglect, while others are classified as nonvictims but may still receive
support.
On a duplicate-count basis, 3,628,283 children were subjects of screened-in reports with dispositions. Of
these, 15.8% were classified as victims with substantiated or indicated findings, while 56.2% had
unsubstantiated dispositions.
To better understand how protection systems work in practice, readers can explore CPGN’s guide on what Child Protective Services does.
Key statistics:
- 2,990,234 children received an investigation or alternative response
- 40.6 per 1,000 children received a CPS response
- 3,628,283 children were subjects of screened-in reports on a duplicate-count basis
- 15.8% were classified as victims with substantiated or indicated findings
- 56.2% had unsubstantiated dispositions
Child Neglect Statistics and Long-Term Impact
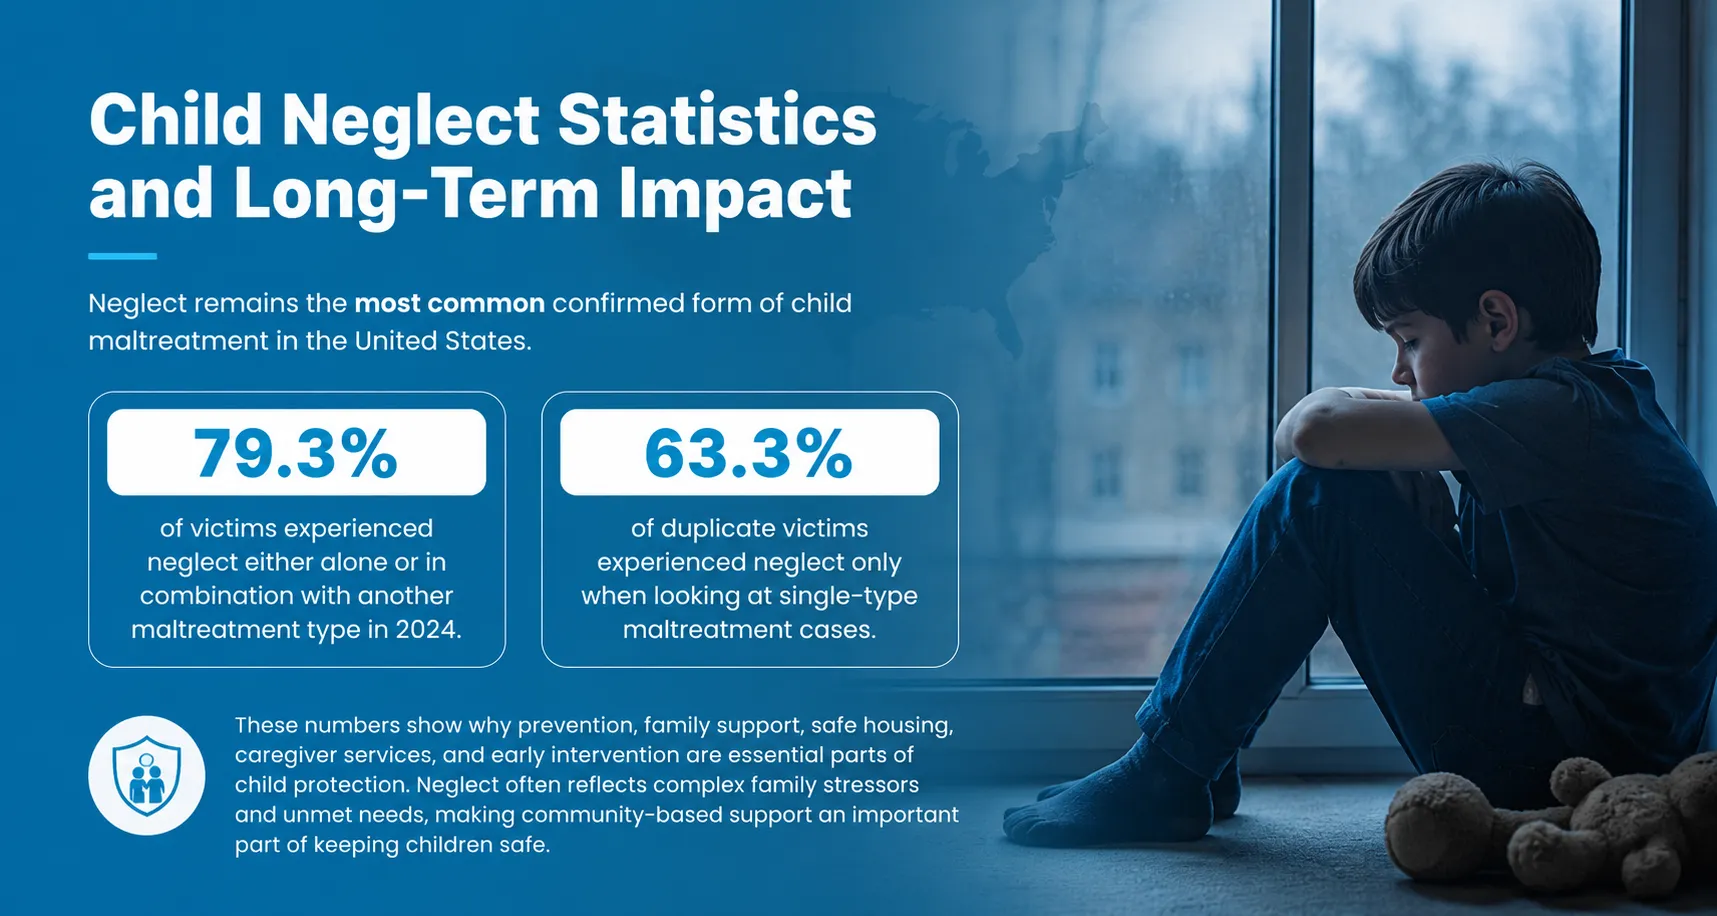
The most recent national child welfare data shows that neglect is the most frequently confirmed form of maltreatment, with 79.3% of victims experiencing neglect alone or alongside another type of abuse.
Neglect can involve a child’s basic needs, safety, supervision, medical care, education, or emotional well
being. Because neglect is often connected to family stress, unmet needs, caregiver challenges, or lack of
support, prevention and early intervention are critical.
These numbers show why prevention, family support, safe housing, caregiver services, and early intervention are essential parts of child protection. Neglect often reflects complex family stressors and unmet needs, making community-based support an important part of keeping children safe.
Key statistics:
- 79.3% of victims experienced neglect alone or with another maltreatment type
- 422,264 victims had neglect as a substantiated maltreatment type
- 63.3% of duplicate victims experienced neglect only
- 364,327 duplicate victims were reported in neglect-only cases
Latest U.S. Child Maltreatment Statistics (2026 Update)
According to the latest available U.S. Child Maltreatment Report, 532,228 children were confirmed victims of abuse or neglect nationwide, representing a victimization rate of 7.2 children per 1,000.
The number of confirmed victims decreased by 14.1% from 2020, when 619,480 victims were reported. Even with this decrease, more than half a million children were confirmed as victims in a single year, showing the continued need for prevention, safe reporting, family support, and trauma-informed services.
Key statistics:
- 532,228 confirmed victims in 2024
- 7.2 victims per 1,000 children
- 14.1% decrease in victims from 2020 to 2024
- 619,480 victims were reported in 2020
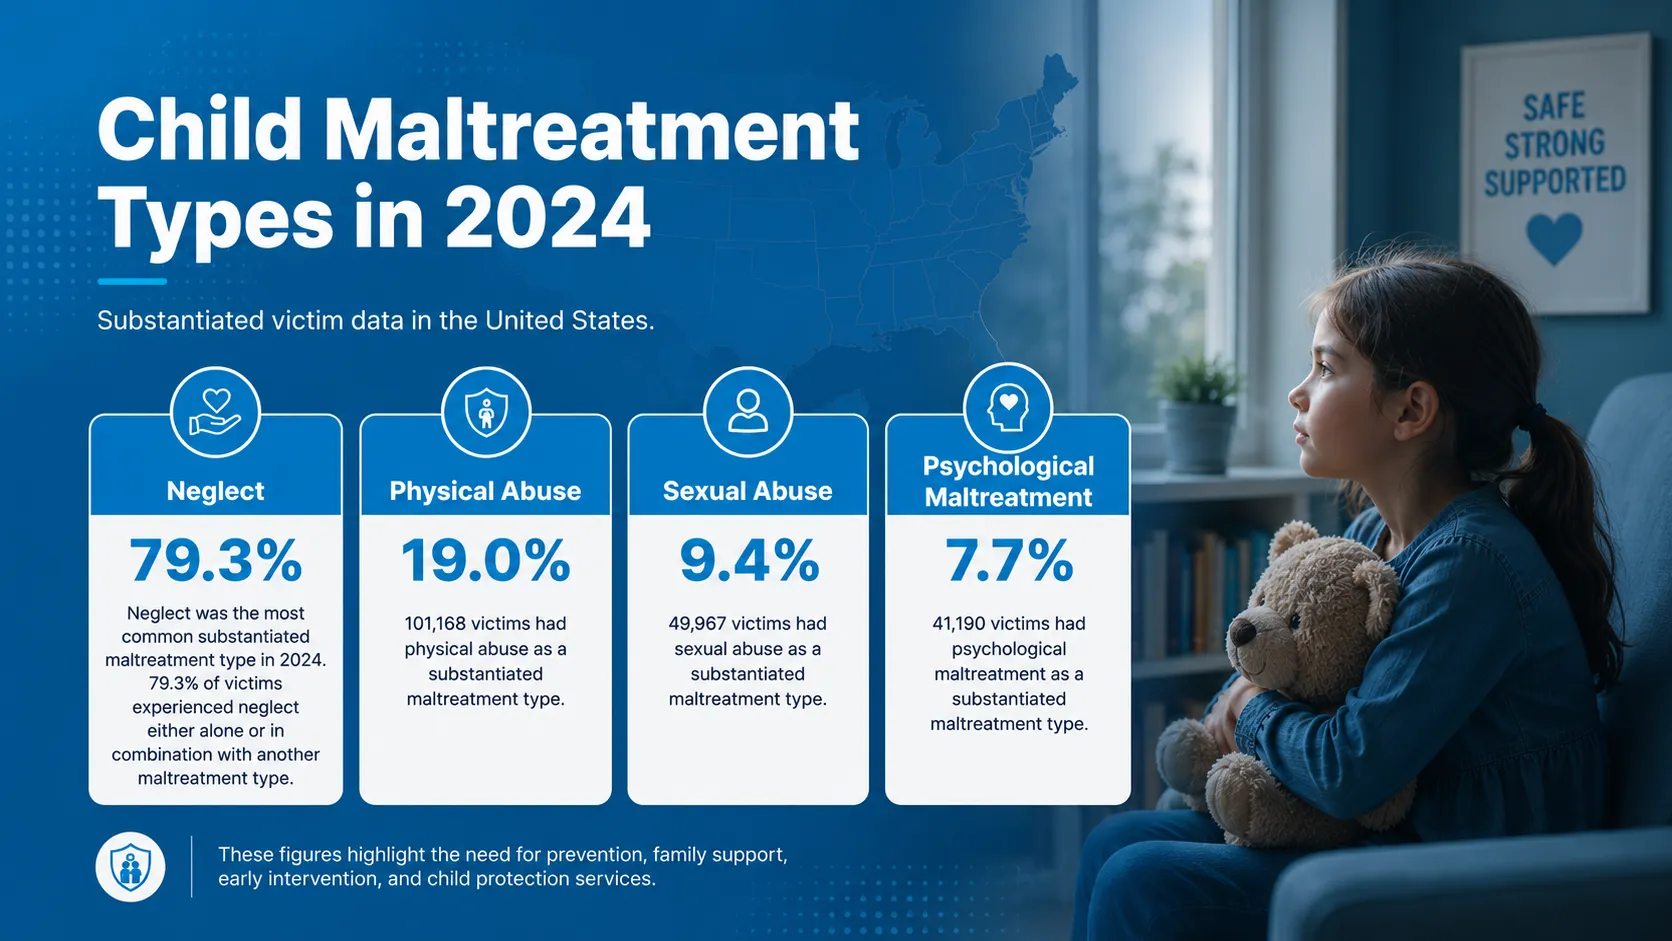
Neglect: 79.3%
Neglect is the most common substantiated form of child maltreatment. The latest available federal data shows that 79.3% of victims experienced neglect either alone or in combination with another maltreatment type.
Physical Abuse: 19.0%
Physical abuse was reported for 19.0% of confirmed victims, representing 101,168 children with substantiated physical abuse.
Sexual Abuse: 9.4%
Sexual abuse was reported for 9.4% of confirmed victims, representing 49,967 children with substantiated sexual abuse.
Psychological Maltreatment: 7.7%
Psychological maltreatment was reported for 7.7% of confirmed victims, representing 41,190 children with substantiated psychological maltreatment.
Child Maltreatment Fatalities
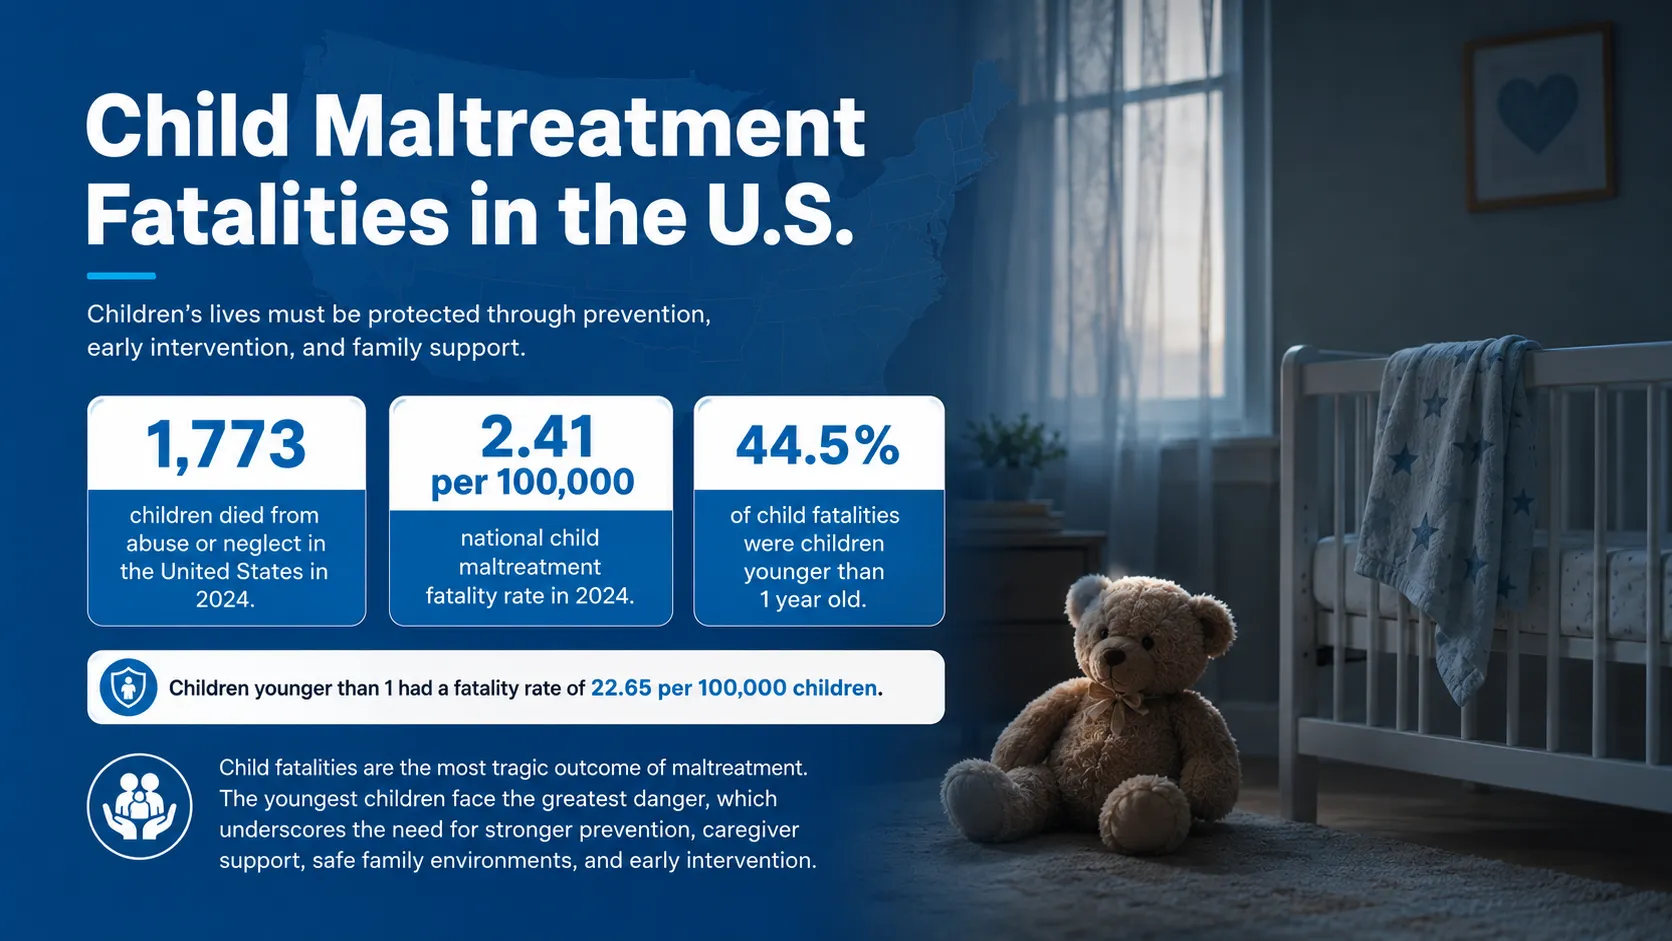
The latest available federal data shows that 1,773 children died from abuse or neglect in the United States. This represents a national child maltreatment fatality rate of 2.41 deaths per 100,000 children.
Child fatalities are the most tragic outcome of maltreatment. The report shows that the youngest children face the greatest danger: children younger than 1 year old represented 44.5% of child fatalities and had a fatality rate of 22.65 per 100,000 children in that age group.
Key statistics:
- 1,773 children died from abuse or neglect
- 2.41 deaths per 100,000 children
- 44.5% of child fatalities were infants younger than 1
- 22.65 per 100,000 fatality rate for infants younger than 1
- 65.7% of child fatalities were children younger than 3
1,773 Child Maltreatment Fatalities
Federal child welfare data shows that 1,773 children died from abuse or neglect in the United States. This represents a national child maltreatment fatality rate of 2.41 deaths per 100,000 children.
44.5% of Deaths Were Infants Under Age 1
Infants were the most vulnerable group. Children younger than 1 year old represented 44.5% of child fatalities and had a fatality rate of 22.65 per 100,000.
Highest Fatality Rate Among Black Children
Black or African-American children had the highest child maltreatment fatality rate at 6.11 deaths per 100,000 Black children. This was higher than the rate for White children (1.75 per 100,000) and Hispanic children (1.39 per 100,000).
No Child Should Become Another Fatality
The youngest children face the greatest danger, and many are too young to speak, seek help, or protect themselves. Help CPGN raise awareness, strengthen prevention, and encourage earlier action before another child is lost.
Stand Up for Vulnerable Children🔒 Securely processed through Givebutter • Donations may be tax-deductible as permitted by U.S. law.
Child Abuse Victims
Child abuse and neglect remain deeply concerning issues in the United States. Federal child maltreatment data shows that 532,228 children were confirmed victims of abuse or neglect, equal to 7.2 victims per 1,000 children.
The youngest children were the most vulnerable. Children from birth through age 2 made up 26.0% of all victims, and infants younger than 1 year old had the highest victimization rate at 20.1 victims per 1,000 children of the same age.
To understand warning signs and types of maltreatment, readers can explore CPGN’s guide on what child abuse is.
- 532,228 confirmed victims
- 7.2 per 1,000 children national victimization rate
- 70.8% of victims were first-time victims
- 5.1 per 1,000 children first-time victim rate
- 26.0% of victims were age birth through 2
- 13.7% of victims were younger than 1 year
Child Abuse and Neglect Victims
Federal child maltreatment data shows that confirmed victimization was not evenly distributed by age, sex, or race and ethnicity. Girls had a higher confirmed victimization rate than boys, while American Indian or Alaska Native children had the highest victimization rate among racial and ethnic groups.
These differences do not mean maltreatment is limited to one group. Children of every background can
experience abuse or neglect. However, the data help identify where prevention, support, and child
protection systems may need to respond more effectively.
Key statistics:
• Girls: 51.6% of victims; 7.6 per 1,000 girls
• Boys: 48.0% of victims; 6.8 per 1,000 boys
• American Indian or Alaska Native children: 13.3 per 1,000
• Black or African-American children: 11.8 per 1,000
• White children: 40.8% of victims
• Hispanic children: 23.8% of victims
• Black or African-American children: 22.7% of victims
Incorporating Recent Victim Data
According to the latest U.S. Child Maltreatment report, 532,228 children were confirmed victims of abuse or neglect. The report also identified 646,211 substantiated maltreatment types, reflecting cases in which a child experienced more than one form of maltreatment.
- 532,228 confirmed victims
- 646,211 substantiated maltreatment types
- 79.3% of victims experienced neglect
- 19.0% experienced physical abuse
- 9.4% experienced sexual abuse
- 7.7% experienced psychological maltreatment
532,228 Confirmed Victims
Federal child welfare data shows that 532,228 children were confirmed victims of abuse or neglect in the United States.
646,211 Maltreatment Types
The report counted 646,211 substantiated maltreatment types, because some children experienced more than one type of maltreatment.
14.1% Decrease Since 2020
Confirmed child abuse and neglect victims decreased by 14.1% from 2020, falling from 619,480 victims to 532,228.
Who Hurts Children—and Where It Happens
Most confirmed child maltreatment is committed by caregivers known to the child. In report, 410,676 unique perpetrators were reported nationally. The majority of perpetrators were parents, and most were adults between the ages of 25 and 44.
The report also shows that 89.1% of victims were maltreated by one or both parents when victim-perpetrator relationship data were analyzed. This does not mean all parents are unsafe; it shows why prevention, caregiver support, safe reporting, and early intervention must focus on the environments where children depend on adults for care and protection.
CPGN’s work addresses complex child protection concerns, including intimate partner violence, negative parental gatekeeping, Munchausen Syndrome by Proxy / FDIA, and child neglect.
- 410,676 unique perpetrators
- 76.3% of perpetrators were parents
- 69.4% of perpetrators were ages 25-44
- 51.9% of perpetrators were female
- 47.0% of perpetrators were male
- 89.1% of victims were maltreated by one or both parents
Children of All Ages Are Affected
Victims were reported across all age groups, but the youngest children were most vulnerable. Children from birth through age 2 represented 26.0% of victims, and infants younger than 1 year old had the highest victimization rate at 20.1 per 1,000.
Girls Had a Higher Victimization Rate
Girls represented 51.6% of victims and had a victimization rate of 7.6 per 1,000 girls, compared with 6.8 per 1,000 boys.
Racial and Ethnic Disparities Remain
American Indian or Alaska Native children had the highest victimization rate at 13.3 per 1,000, followed by Black or African-American children at 11.8 per 1,000.
Most Victims Were Maltreated by Parents
The report found that 89.1% of victims were maltreated by one or both parents. The largest relationship categories were mother acting alone (37.0%), father acting alone (25.0%), and two parents acting together (19.3%).
Caregiver Risk Factors Were Common
Among reporting states, 109,772 victims (27.6%) had a domestic violence caregiver risk factor, and 101,059 victims (25.1%) had a drug abuse caregiver risk factor.
Neglect Was the Most Common Maltreatment Type
Neglect remained the most common confirmed maltreatment type. 79.3% of victims experienced neglect either alone or in combination with another maltreatment type.
How Do Children Heal After Abuse?
Children and families may receive services after CPS involvement to support safety, stability, and recovery. In the latest report 880,436 children received postresponse services from CPS agencies. These services are provided after an investigation or alternative response and may address child safety, family needs, and conditions that brought the child to CPS attention.
The report also shows that 2,230,175 children received prevention services. Prevention services are designed to strengthen families, reduce risk, and help prevent future abuse or neglect before harm escalates.
Healing also requires community awareness, survivor-centered support, and safe spaces where people can speak up. CPGN encourages families and survivors to use its Share Your Stories platform when they are ready to raise awareness or share lived experience.
- 880,436 children received postresponse services
- 56.8% of duplicate victims received postresponse services
- 20.4% of duplicate nonvictims received postresponse services
- 2,230,175 children received prevention services
- 42 days average time to service initiation
- 28 days median time to service initiation
Protection Does Not End With a Report
Children affected by abuse and neglect may need safety, advocacy, family support, early intervention, and a community that refuses to look away. Your donation helps CPGN advance child-protection efforts that support safer futures for children and families.
Help Build a Safer Future✓ U.S.-registered 501(c)(3) nonprofit • Secure donation through CPGN’s official Givebutter page.
Support Services Provided to Help Children Heal:
- 880,436 children received postresponse services from CPS agencies.
- 102,765 victims received foster care postresponse services and had a removal date on or after the report date.
- 50,627 victims had court-appointed representatives.
- 48,799 victims received family preservation services within the previous five years.
- 36,345 victims were referred to Part C early intervention services under IDEA.
These services show that child protection does not end with investigation. Children often need safety planning, family support, court representation, foster care services, early intervention, and ongoing community-based care.
Holistic Recovery Approach:
Child protection requires both prevention and response. Federal child welfare data shows that Community-Based Child Abuse Prevention Grants were the largest reported prevention-service funding source, reaching an estimated 813,365 children. Promoting Safe and Stable Families was the second largest source, with an estimated 642,188 child recipients.
Postresponse services also played a major role. More than half of duplicate victims received postresponse services, and thousands of children received foster care services, court-appointed representation, family preservation support, reunification-related services, or early intervention referrals.
CPGN supports a holistic approach through advocacy, awareness, and child protection programs designed to strengthen families and improve child safety.
- 2,230,175 children received prevention services
- 813,365 estimated child recipients through CBCAP
- 642,188 estimated child recipients through PSSF
- 880,436 children received postresponse services
- 59.9% of eligible victims were referred to Part C agencies in states reporting both eligibility and referral data
These numbers show that recovery and protection require more than investigation alone. Children need safe adults, timely support, prevention services, court and advocacy systems when needed, and strong community responses that reduce risk before harm escalates.
Every statistic represents a child whose safety, stability, and future matter.
Protect a Child Today
As a registered 501(c)(3) nonprofit, we focus on preventing abuse and protecting children at risk. Your donation helps create a safer future.
Sources & References
- U.S. Department of Health & Human Services, Administration for Children and Families, Administration on Children, Youth and Families, Children’s Bureau — Child Maltreatment report
- Data source: National Child Abuse and Neglect Data System (NCANDS)
- Reporting year: Federal Fiscal Year 2024
- Coverage: 50 states, the District of Columbia, and Puerto Rico
This page uses statistics from the ACF Children’s Bureau Child Maltreatment 2024 report. Statistics are updated when new federal child maltreatment reports are released. Last reviewed: June 23, 2026.
Mark S.
Mark S. is a dedicated child protection advocate and co-founder of Child Protection Global Network (CPGN). With a background in community development and public education, he supports CPGN’s mission to protect children from abuse and neglect through awareness, prevention education, and community guidance.
Through his work with CPGN, Mark helps families, educators, and communities better understand child safety, recognize warning signs, and take informed steps when a child may be at risk. His writing focuses on making child protection information clear, practical, and accessible for people who want to create safer environments for children.
Mark believes that protecting children begins with awareness, early action, and stronger community responsibility. His work reflects CPGN’s commitment to helping every child feel safe, heard, and protected.
All Posts
FAQS
Children younger than 1 year old had the highest victimization rate in 2024, at 20.1 victims per 1,000 children of the same age.
The Child Maltreatment 2024 report does not rank domestic violence caregiver risk by demographic group. It reports that in 36 reporting states, 109,772 victims (27.6%) had a caregiver risk factor of domestic violence.
Girls had a higher confirmed victimization rate than boys in 2024. Girls represented 51.6% of victims and had a rate of 7.6 per 1,000 girls, compared with boys at 6.8 per 1,000 boys.
For confirmed child maltreatment victimization, American Indian or Alaska Native children had the highest rate at 13.3 per 1,000 children, followed by Black or African-American children at 11.8 per 1,000 children. For child maltreatment fatalities, Black or African-American children had the highest fatality rate at 6.11 per 100,000 children.
The report does not break down the domestic violence caregiver risk factor by race or ethnicity. For overall confirmed child maltreatment victims, the largest shares were White children (40.8%), Hispanic children (23.8%), and Black or African-American children (22.7%). Rates were highest for American Indian or Alaska Native children and Black or African-American children.

See a child in danger? If you are in immediate danger, call local emergency services. For guidance from CPGN, GET HELP.
CPGN is a 501(c)(3)—donations are tax-deductible where applicable. Our goal is to ensure the safety and protection of every child until it is achieved.
Quick Links

See a child in danger? If you are in immediate danger, call local emergency services. For guidance from CPGN, Get Help.
CPGN is a 501(c)(3) — donations are tax-deductible where applicable. Our goal is to ensure the safety and protection of every child until it is achieved.
Copyright © 2026 CPGN. All rights reserved by Majnate LLP | Privacy Policy | Terms and Conditions